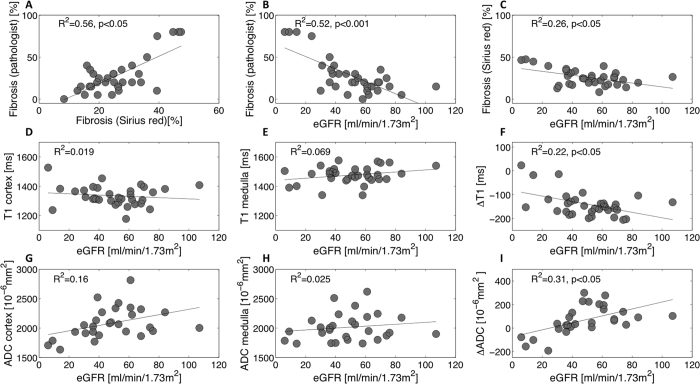
Figure 6. eGFR versus Fibrosis, T1 and ADC in kidney allograft recipients undergoing routine kidney biopsy (n = 32, 28 and 32).
eGFR was calculated using the CKD-EPI equation, except in one patient presenting with AKI at the time of biopsy. A strong positive correlation between IF estimated by pathologist-assessed Masson trichrome and IF quantified by Sirius red staining was measured (R2 = 0.56, p < 0.05) (A). Negative correlations were measured between IF (Masson trichrome) and eGFR (R2 = 0.52, p < 0.001) (B) and between IF (Sirius red) and eGFR (R2 = 0.26, p = 0.002) (C). T1 (cortex, medulla) and eGFR were non-correlated (R2 = 0.019 in the cortex (D) and R2 = 0.069 in the medulla (E)). However, the cortico-medullary difference ΔT1 showed a negative tendency with the increase of eGFR (F). Compared to cortex or medulla alone (G,H), ΔADC also improved the correlation with eGFR (R2 = 0.31, p < 0.05) (I).

