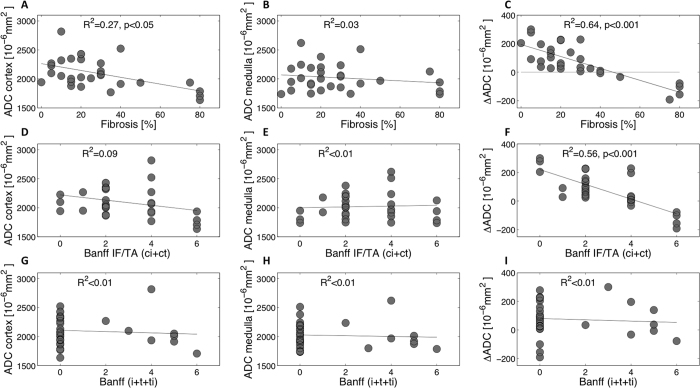
Figure 9.
Correlations between histopathological results (fibrosis estimated by pathological assessment of Masson trichrome (A–C), Banff IF/TA (ci+ct) (D–F) and Banff (i+t+ti) (G–I)) and ADC values in the cortex and medulla, and ΔADC of 29 KARs. ΔADC (in 10−6 mm2/s) was calculated as the difference between cortical and medullary ADC. Cortical IF (estimated by pathological assessment of Masson trichrome) was moderately correlated with cortical ADC (A) but strongly with ΔADC (R2 = 0.64, p < 0.001) (C). All patients with more than 40% IF presented a negative ΔADC. A strong negative correlation was also measured with Banff IF/TA (ci+ct), whereas no correlation with interstitial inflammation assessed by Banff (i+t+ti) was measured (G–I).

