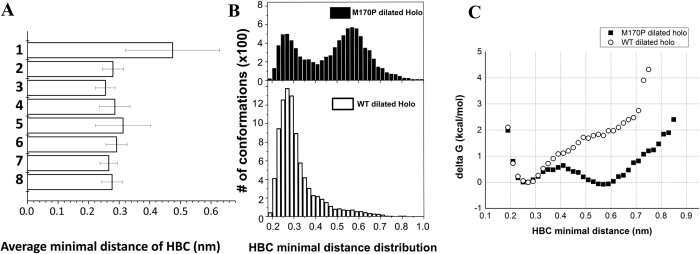
Figure 4.
(A) Average minimal distance of HBC gate over simulation time in eight simulation systems. (B) Frequency count of the HBC minimal distance over 10–100 ns MD trajectories in the M170P dilated holo and WT dilated holo systems, respectively. Data of minimal distances were counted in increments of 0.02 nm. (C) Free energy changes of HBC gate opening was estimated using 

