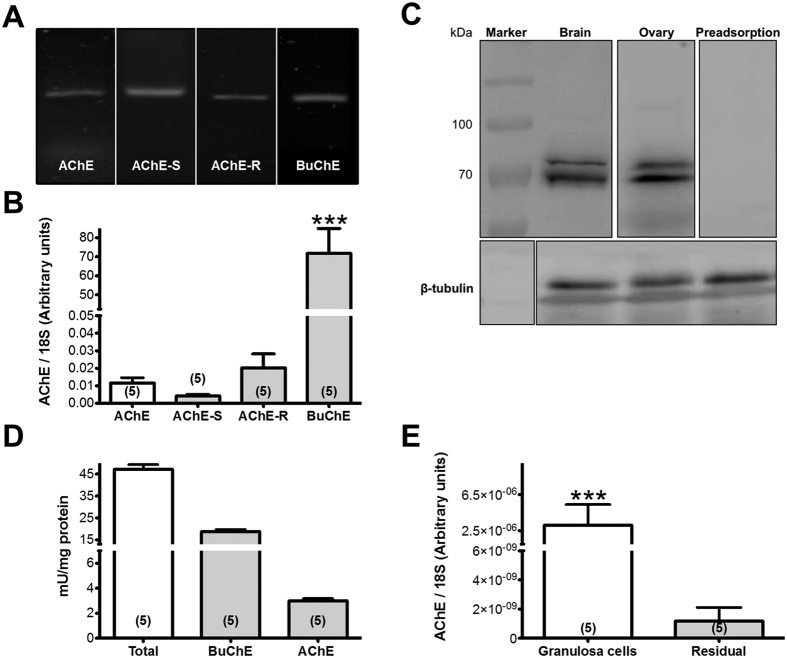
Figure 1. Detection of AChE in the rat ovary.
(A) Results of RT-PCR experiments (ethidum bromide stained gel; different gels under same experimental conditions). The bands correspond to AChE, isoforms of AChE and BuChE. (B) qPCR data in bars correspond to means + S.E.M. of n = 5 independent samples (***P < 0.001). (C) Western blot analysis of AChE and β-tubuline control in the ovary and brain (different blots under same experimental conditions). Note two bands, which may be splice variants. Preadsorption of ovarian protein abolished the specific staining of the protein bands. (D) Results of cholinesterase activity measurements determined by Ellman assay. Results are the mean + S.E.M. of n = 5 independent measurements. (E) Distribution of AChE between granulosa/luteal cells and theca/interstitial cells determined by qPCR. Results are the mean + S.E.M. of n = 5 samples (*** P < 0.001).

