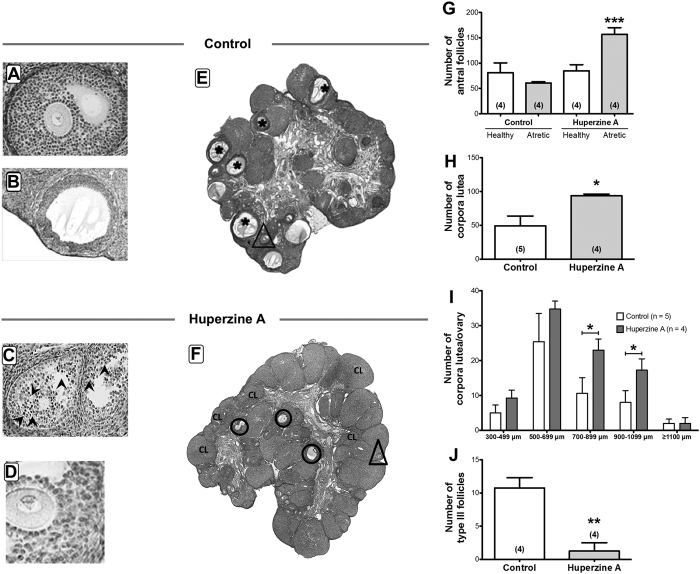
Figure 5. Effects of HupA on the ovarian follicular development in the rat.
(A) Representative picture of a healthy antral follicle of a control ovary. (B) Example for a precystic follicle appearing in the control group. (C) Example for an atretic follicle of a HupA treated ovary. (D) Example for a healthy follicle of a HupA treated ovary. (E,F) Sections of a control (E) and a HupA treated (F) ovary are depicted to highlight increased occurrence of CL and atresia of antral follicles (ellipses in F and magnification in C, in which arrowheads show atretic cells, in comparison to a healthy antral follicle (B) after HupA exposure. Asterisks indicate precystic follicles and triangles show healthy antral follicles. (G) Quantification of the number of antral follicles (healthy and atretic) showed an increase of atretic antral follicles in the HupA group. (H) CL number is significantly increased after HupA treatment. (I) Values for the number of CL corresponding to the mean diameter. An increased number of CL with 700–899 μm and 900–1099 μm diameter after HupA exposure was observed. (J) Decrease in number of precystic type III follicles after HupA treatment. All values are shown as mean + S.E.M. of n = 4 or n = 5 individual control or HupA-exposed rats (*P < 0.05; **P < 0.01; ***P < 0.001).

