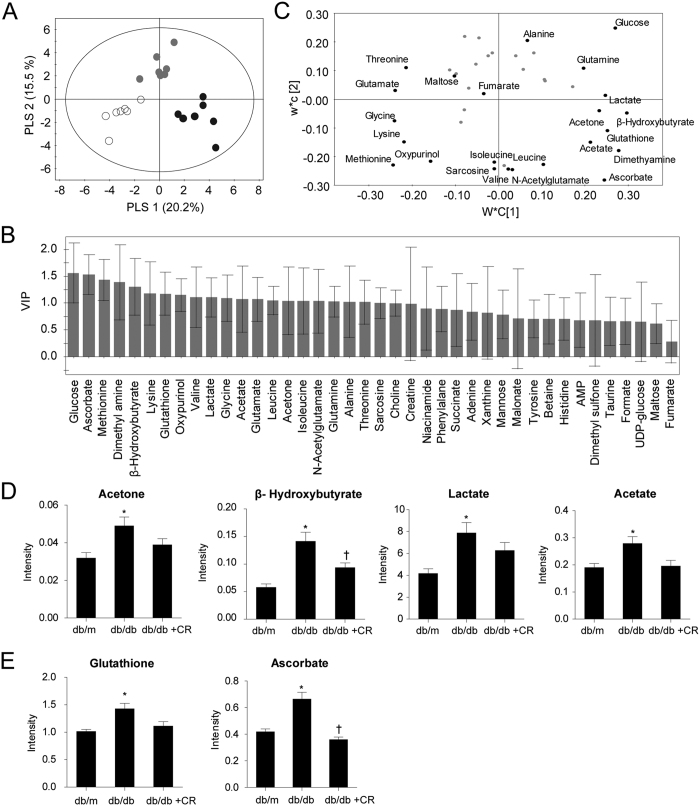
Figure 2. Quantification of aqueous metabolites in liver samples.
Score scatter plot (A), variable importance of projection (VIP) score plot (B), and loading plot (C) of the partial least-squares discriminant analysis (PLS-DA) model. Score plot shows a good separation among db/m (circle), db/db (black dots), and db/db+caloric restriction (CR; gray dots) mice. Identified metabolites that have high VIP values (>1) are presented in the loading plot. Quantified metabolites (D,E) with high VIP values are related to inflammation, energy, and lipid metabolism. Data are shown as the mean ± SEM. *p < 0.017 for db/db versus db/m mice. †p < 0.017 for db/db+CR versus db/db mice.

