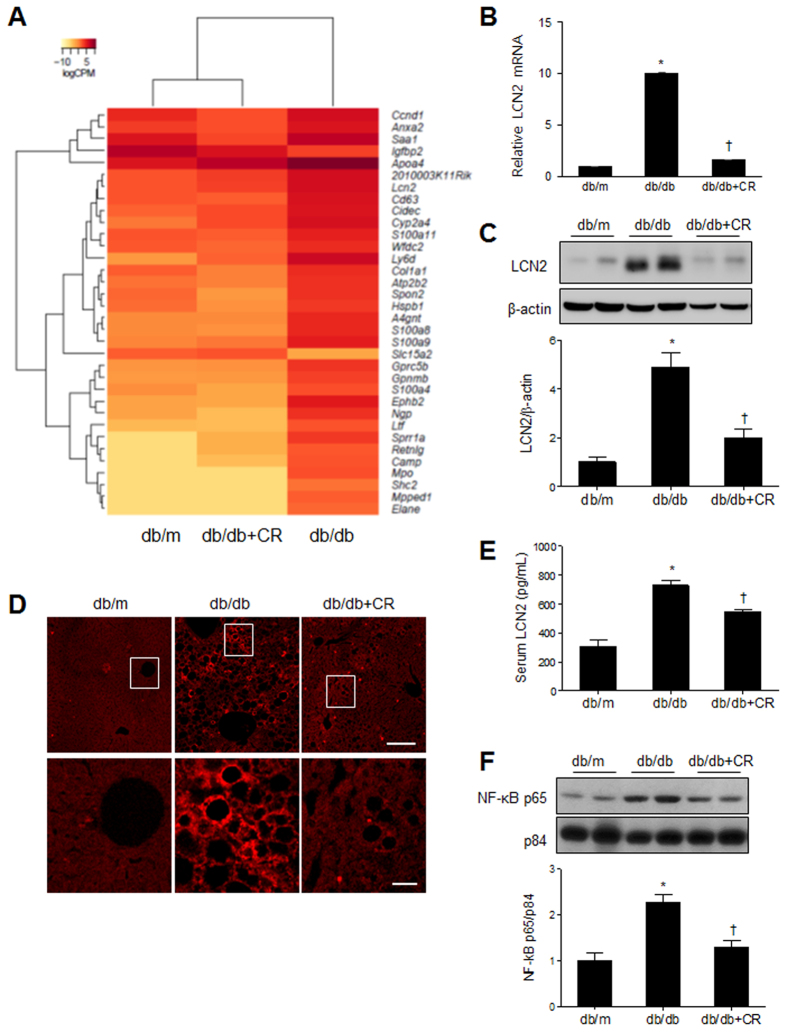
Figure 6. Effects of caloric restriction (CR) on inflammation in the livers of db/db mice.
(A) The differential expression of genes in WT or db/db+CR versus db/db mice was color-shaded after NGS-based RNA-seq analysis. Genes shown in red have up-regulated expression and those shown in yellow have down-regulated expression (Table S3). (B) Quantitative RT-PCR analysis of LCN2 in the liver. (C) Western blots and quantifications showing hepatic LCN2 expression (band intensity normalized to β-actin). (D) Representative immunofluorescent images of LCN2 in liver sections (scale bar, 100 μm). (E) Serum LCN2 levels. (F) Western blots and quantifications showing nuclear NF-kBp65 expression (band intensity normalized to p84). Data are shown as the mean ± SEM. *p < 0.05 for db/db versus db/m mice. †p < 0.05 for db/db+CR versus db/db mice.

