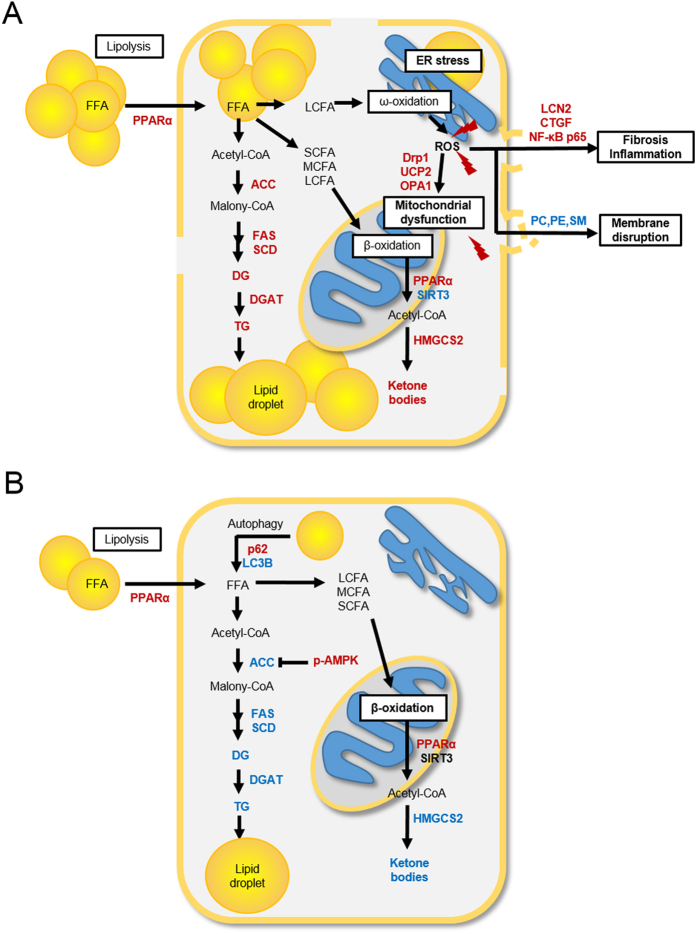
Figure 7. Changes in hepatocyte metabolism in non-alcoholic fatty liver disease (NAFLD) and caloric restriction (CR) states.
Increased metabolites and enzymes are shown in red and decreased in blue. Non-detection or no change is shown in black. (A) NAFLD model compared with the db/m model. (B) CR model compared with the NAFLD model.

