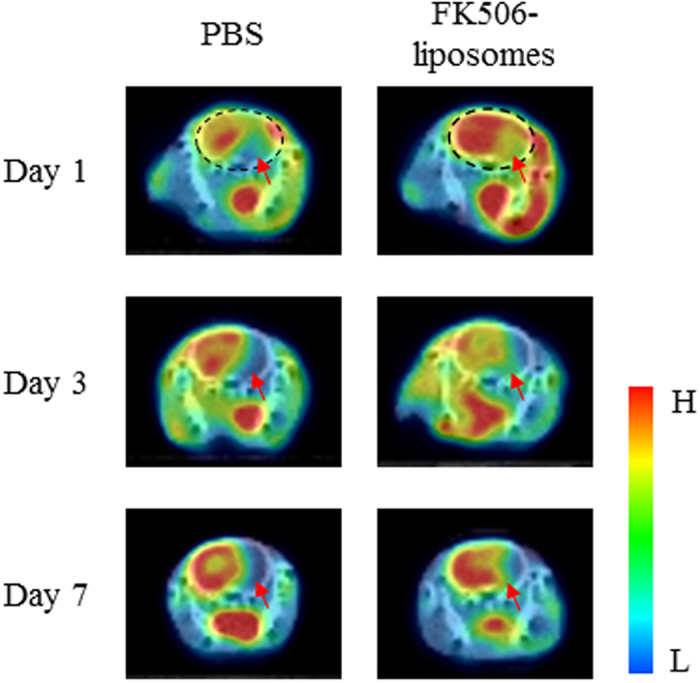
Figure 5. Evaluation of the neuroprotective effect of FK506-liposomes by use of the MC-I-specific PET probe [18F]BCPP-EF.

PET scans were performed for 60 min with [18F]BCPP-EF (10 MBq/rat) at 1, 3, and 7 days after reperfusion. Summation PET images from 10 to 30 min were reconstructed to obtain standardized uptake value (SUV) images. The PET images were superimposed on the corresponding X-CT images. The black dotted circles (the images in day 1) indicate the position of the brain in the PET/CT images. The red arrows in the images indicate the ischemic hemisphere (right brain hemisphere), and the bar shows the relative level of signal intensity ranging from high (red) to low (blue).
