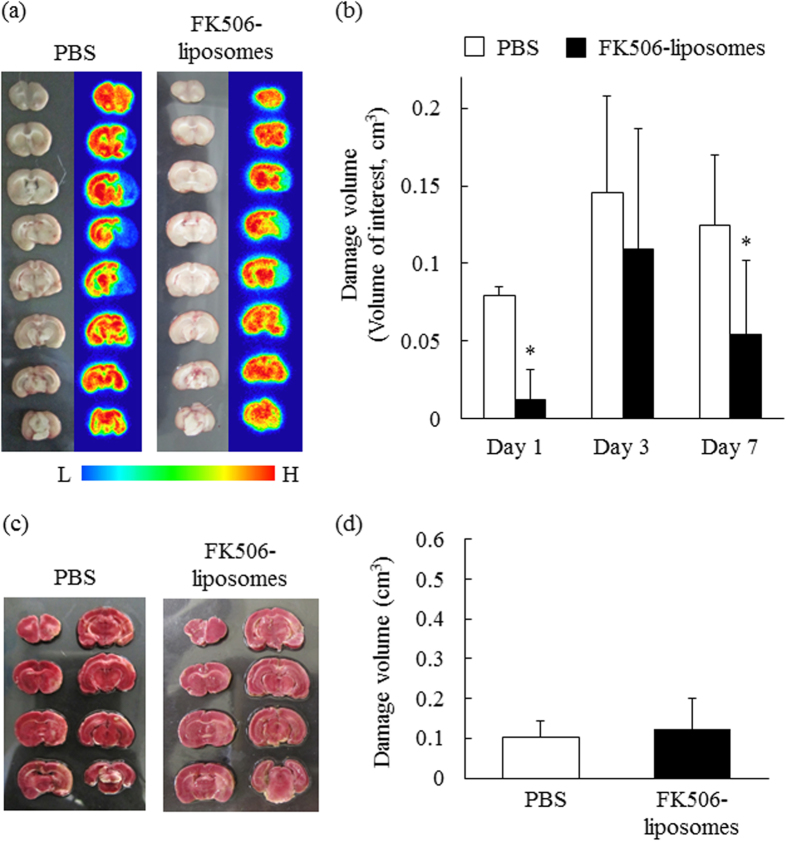
Figure 6. Visualization of the neuroprotective effect of FK506-liposomes by PET using [18F]BCPP-EF.
PET scans were conducted for 60 min as described in the legend of Fig. 5. (a) Representative images of brains (a: left) and autoradiograms (a: right) after PET measurement at 7 days after reperfusion. The right brain hemisphere in the slices shows the ischemic hemisphere. The bar indicates the relative level of signal intensity, ranging from high (red) to low (blue). (b) The volume of brain damage was determined by obtaining VOIs in the reconstructed [18F]BCPP-EF PET images at day 1, 3 and 7. (c,d) The damaged brain volume assessed by TTC staining at day 7 was calculated using Image J. Data are presented as the mean ± S.D. (n = 5). Significance of differences: *P < 0.05 vs. PBS.

