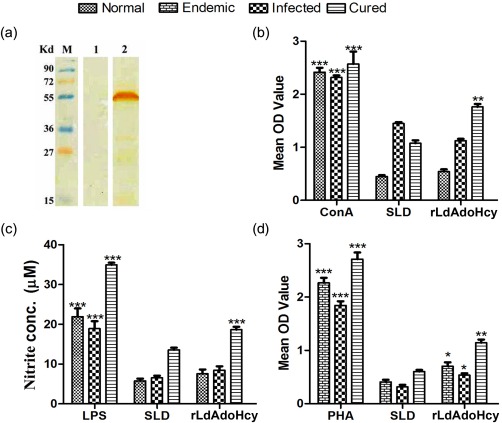
Figure 1.

Cellular immune response to recombinant Leishmania donovani S‐adenosyl‐L‐homocysteine hydrolase (rLdAdoHcy) in treated hamsters and visceral leishmaniasis (VL) patients. (a) Reactivity of human sera to rLdAdoHcy: M = molecular weight marker; lane 1 = reactivity of rLdAdoHcy with pooled normal human sera (n = 5); lane 2 = reactivity of rLdAdoHcy with pooled VL patients' sera (n = 5). (b) LTT response of mononuclear cells from normal, L. donovani‐infected and treated hamsters in response to concanavalin (ConA), soluble L. donovani antigen (SLD) and rLdAdoHcy at concentration of 10 µg/ml each. Each bar represents the pooled data [mean ± standard deviation (s.d.) value] of six hamsters and the data represent the means of triplicate wells ± s.d. of each hamster as mean optical density (OD) of stimulated cells and mean OD of unstimulated control cells. (c) Nitric oxide (NO) production (µM): peritoneal macrophages were stimulated with the supernatants of stimulated lymphocytes of normal/infected/cured hamsters in response to rLdAdoHcy, SLD and lipopolysaccharide (LPS), respectively, at 10 µg/ml each. The estimation of NO production was performed using Griess reagent in supernatants collected from macrophage cultures 24 h after incubation, and OD was measured at 540 nm. (d) Lymphocyte transformation test (LTT) response of peripheral blood mononuclear cells (PBMCs) from L. donovani‐infected endemic and patients in clinical remission against phytohaemagglutinin (PHA), SLD and rLdAdoHcy stimulation at a concentration of 10 µg/ml each. Proliferative response was represented as mean OD of stimulated cell – mean OD of unstimulated control. Each bar represents the pooled data (mean ± s.d. value) of stimulated PBMCs of each group. Significance values in figures b,c and d indicate the differences between ConA, LPS, PHA and rLdAdoHcy stimulation against SLD (*P < 0·05, **P < 0·01; ***P < 0·001).
