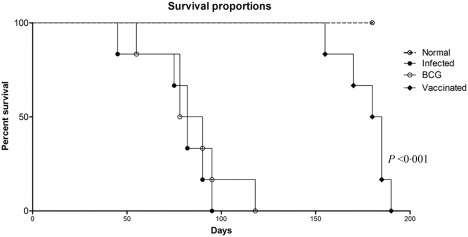
Figure 7.

Survival curve analysis of different experimental groups: survival of animals (six hamsters in each experimental group) was observed up to day 180 post‐challenge (p.c.). Significance values indicate the difference between the vaccinated and infected (unvaccinated) control groups.
