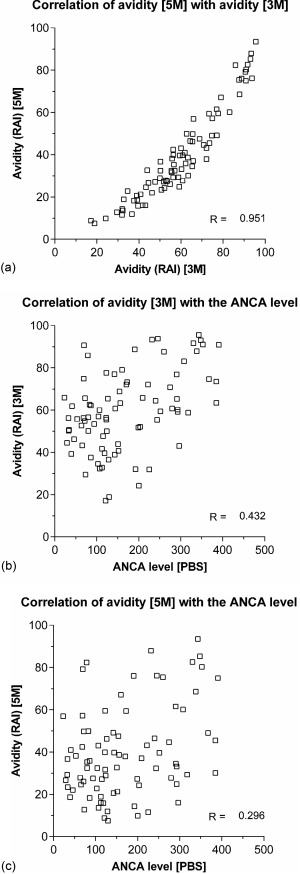
Figure 1.

(a) The correlation of the relative avidity index as measured with a urea concentration of 5 M and 3 M. (b) The correlation of the anti‐neutrophil cytoplasmic antibodies (ANCA) level as measured in phosphate‐buffered saline (PBS) with the relative avidity index as measured with a urea concentration of 3 M. (c) The correlation of the ANCA level as measured in PBS with the relative avidity index as measured with a urea concentration of 5 M.
