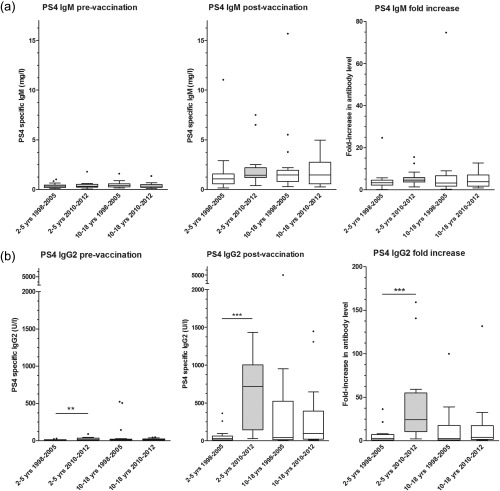
Figure 3.

Box‐plot showing pre‐ and post‐vaccination serotype 4‐specific IgM (a) and immunoglobulin (Ig)G2 levels (bB) as well as fold increase. Only 2–5‐year‐old children tested in 2010–12 were vaccinated with PCV‐7 (grey box‐plot). *P‐value between 0·01 and 0·05; **P‐value between 0·001 and 0·01; ***P‐value < 0·001. Median (horizontal line) and quartiles (box) are shown.
