
Figure 1.
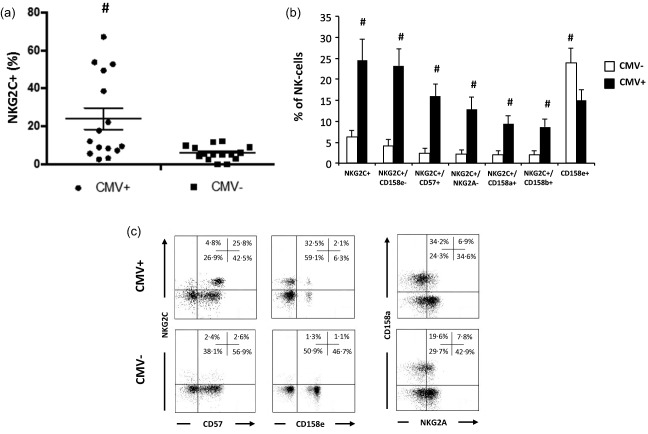
Latent cytomegalovirus (CMV) infection is associated with marked alterations in natural killer (NK) cell phenotype. (a) Whisker dot‐plot for the proportion of NKG2C+ NK cells based on latent CMV infection (n CMV+ = 15; n CMV– = 15). (b) Proportions of peripheral blood CD3–/CD56+ NK cell subsets based on latent CMV infection. Values are mean ± standard error. Statistically significant differences are indicated by #P < 0·05. (c) Representative flow cytometry dot‐plots for the co‐expression of NKG2C with CD57 and CD158e, and the co‐expression of CD158a with NKG2A on NK cells based on CMV status.