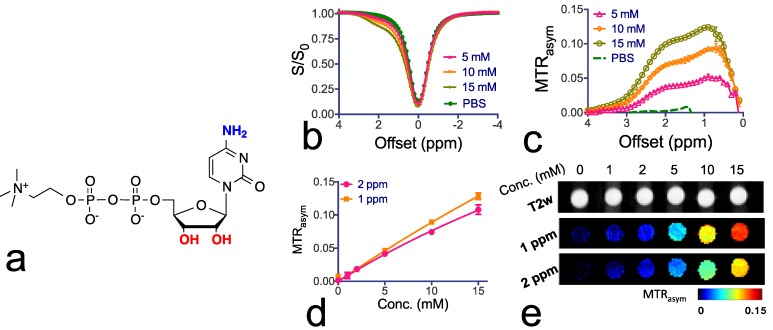
Figure 1.
Chemical structure and CEST properties of citicoline. (a) Molecular structure of citicoline with the exchangeable protons marked in blue (NH2) and red (OH). (b) Z-spectra and (c) MTRasym plots of the CEST contrast of citicoline at 5, 10, and 15 mM. (d) Concentration dependence of the CEST contrast at frequency offsets 1 ppm (OH) and 2 ppm (NH2), respectively. (e) T2w images (top row) and corresponding CEST parametric maps at 1 ppm (middle row) and 2 ppm (bottom row). CEST MRI data were acquired at 37oC using B1=3.6 µT and Tsat= 3 seconds. All samples were at pH 7.4 in PBS buffer. Data are presented as mean ± standard deviation of three replicates.

