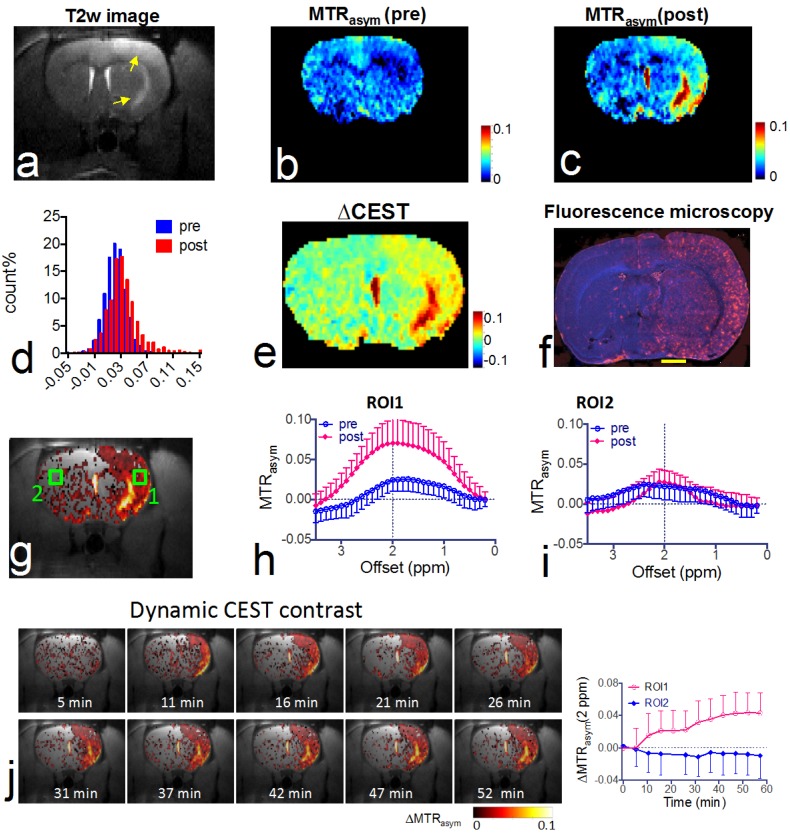
Figure 4.
In vivo CEST MRI detection of the delivery of citicoline- liposomes in rat brain after acute ischemic injury. (a) T2w MRI showing hyperintensity in the injured areas. (b) CEST images (MTRasym maps at 2.0 ppm) before and (c) at 1.5 hours after i.a. injection of CDPC-lipo, showing the elevated CEST signal in the ischemic region. (d) Histogram of the CEST signal before and after administration. (e) ∆CEST map as calculated by ∆MTRasym= MTRasym(post)-MTRasym(pre). (f) Fluorescence microscopy of nuclei (blue, stained with DAPI) and liposomes (red, rhodamine-B-labeled). Scale bar= 2 mm. (g) Overlay image of the ∆CEST map and the T2w image with the two ROIs chosen for ROI analysis. (h) MTRasym plots before (blue) and (i) at 1.5 hours after (red) i.a. injection of CDPC-lipo for ROI 1 and ROI 2, respectively. (j) The dynamic CEST contrast change of the stroke within the first 1.5 hours after i.a. injection of CDPC-lipo. Left: dynamic CEST images calculated by The dynamic CEST contrast was quantified by ΔMTRasym(t)=MTRasym(t) - MTRasym(t=0); Right: the mean ROI CEST signal change of the two ROIs shown in g, where data are presented as mean ± standard deviation.

