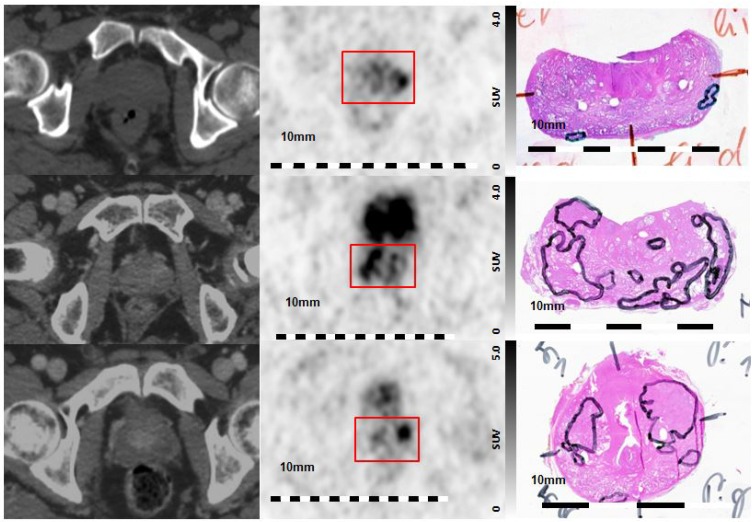
Figure 4.
Visual Evaluation of spatial correlation between PSMA PET and histopathology. Step sections were coregistered to 68Ga-HBED-CC-PSMA PET images Left column: axial CT images, middle column: corresponding axial 68Ga-HBED-CC-PSMA PET images, right column: corresponding histopathological slices (manual coregistration). Upper line: poor overlap between PET and histopathology in patient 5. Note the small and lentiform shaped tumors. Middle line: good overlap of PET and histopathology in patients 1, and lower line: moderate overlap in patient 9. Red box: area of prostatic gland in PET images.

