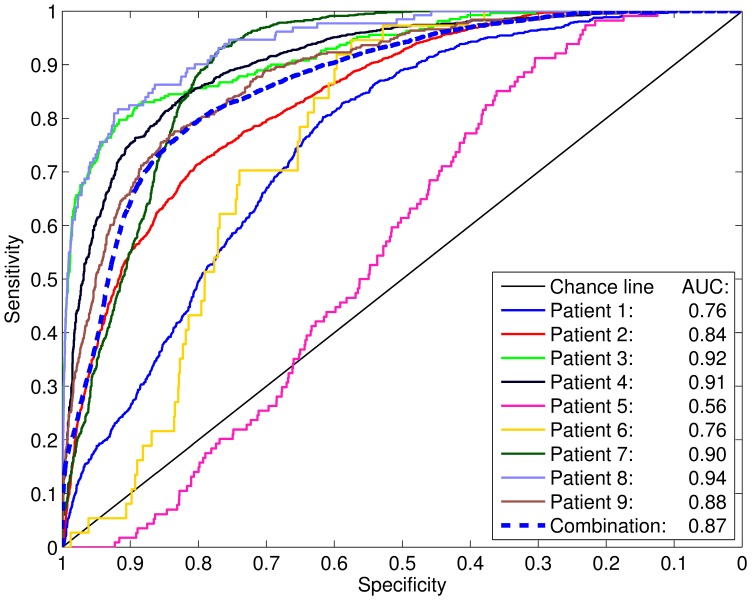
Figure 6.
For each patient, the PSMA-PET was compared to the coregistered, binarized (i.e. not smoothed) histopathology model in a ROC analysis. The areas under curve (AUC) are indicated. The dashed “combination” line represents the ROC analysis including all voxels of all patients combined into a single dataset.

