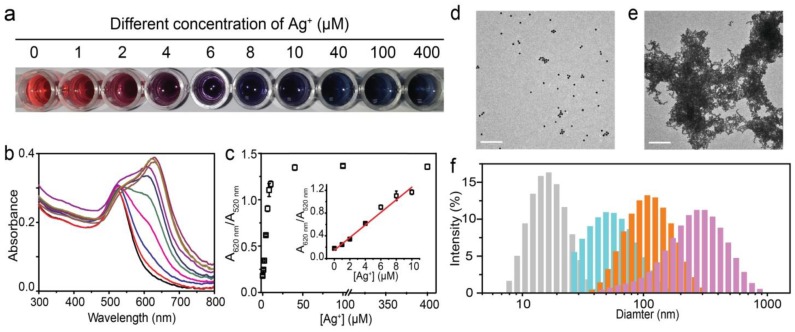
Figure 2.
The aggregation of alkyne-functionalized AuNPs induced by silver ions. a, Visual colour distribution upon treatment of the alkyne-functionalized AuNPs system with various concentrations of Ag+ range from 1 to 400 μM. The photograph was taken less than three seconds after the addition of Ag+. b, UV-Vis spectra of the alkyne-functionalized AuNPs system in the presence of Ag+ with concentrations from 1 to 400 μM. The absorbance at 620 nm indicates the aggregation of alkyne-functionalized AuNPs. c, Plot of A620 nm/A520 nm against different concentrations of Ag+. The inset is a linear relationship at low concentration of Ag+. Error bars are based on three independent measurements. d, e, Transmission electron microscopy (TEM) images of the dispersed and aggregated alkyne-functionalize AuNPs in the absence (d) and presence (e) of Ag+. Scale bar: 200 nm. f, DLS analysis of alkyne-functionalized AuNPs in the presence of 0 μM (gray), 4 μM (blue), 8 μM (orange), 40 μM (purple) silver ions.

