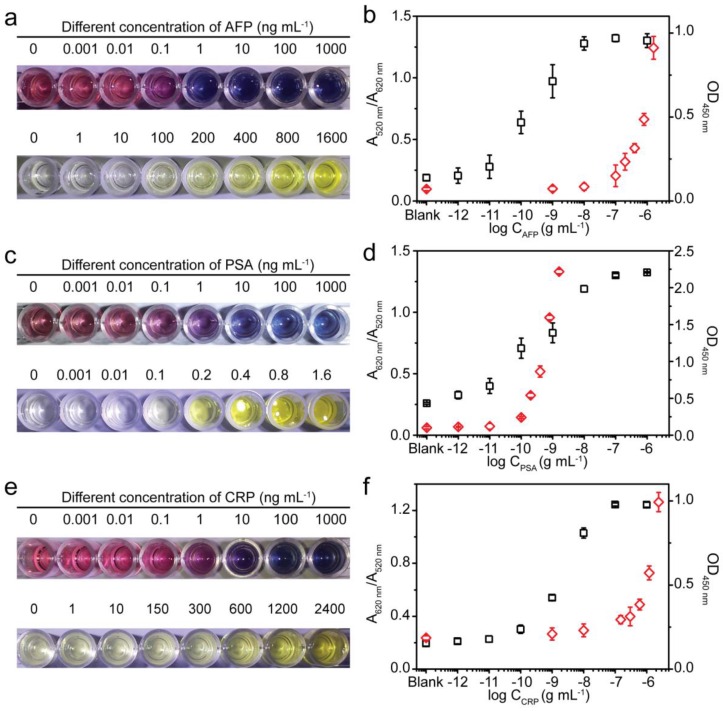
Figure 3.
A comparison between the MeLISA and conventional ELISA for biomarker detection. a, Photographs showing the performance for AFP detection using the MeLISA and commercial ELISA kit. b, Values of corresponding peak absorbance versus different AFP concentrations. The black squares represent the value of A620 nm/A520 nm obtained through the MeLISA and red diamonds represent the value of OD450 nm obtained through conventional ELISA. c, The detection of PSA using our MeLISA and ELISA. d, Values of corresponding peak absorbance versus different PSA concentrations. e, The detection of CRP using MeLISA and ELISA. f, Values of corresponding peak absorbance versus different CRP concentrations. Error bars are based on three independent measurements.

