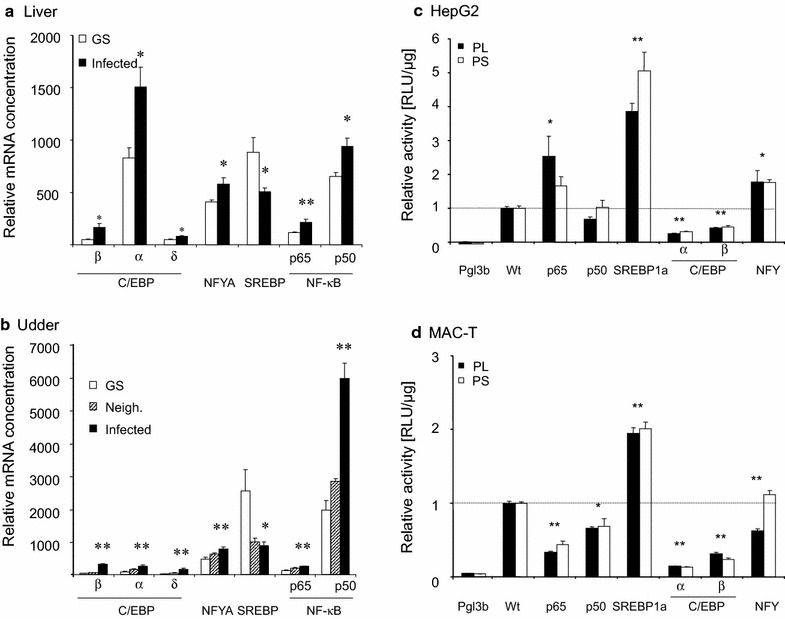
Fig. 2.

Expression of transcription factors (TF) in livers (a) or udders (b) and effect of overexpressing TFs on the promoter of SCD1 in HepG2 (c) or MAC-T (d) cells. The concentration of the mRNAs encoding the respective factors was determined in RT-qPCR and was normalized against 1000 copies of the SFRS4 factor. a Liver samples were from healthy (GS) or udder infected cows (infected). b Udder samples were from healthy cows, or from sterile quarters neighboring (Neigh.) infected (Infected) ones. Error bars represent S.E.M.; asterisks indicate significance of difference to the value from healthy control cows (*P < 0.05; **P < 0.01). Reporter gene constructs (1 µg) expressing the Firefly-luciferase under the control of the long (PL) or short (PS) promoter segment were transfected into the c HepG2 or d MAC-T cells, together with 0.2 µg of vectors expressing the bovine transcription factors, as indicated. Lucifearse activity was assayed 48 h later from triplicate wells. Activity was calculated as RLU/µg of protein lysate. Represented are the mean values from two independent determinations and expressed as fold changes relative to controls set as 1.0 (dotted line), having received the reporter gene together with the empty vector used for establishing the expression constructs. Control measurements of the promoter-less pGL3-basic vector are also shown (Pgl3b). Error bars represent S.E.M.; asterisks indicate significance of difference to the value from healthy control cows (*P < 0.05; **P < 0.01)
