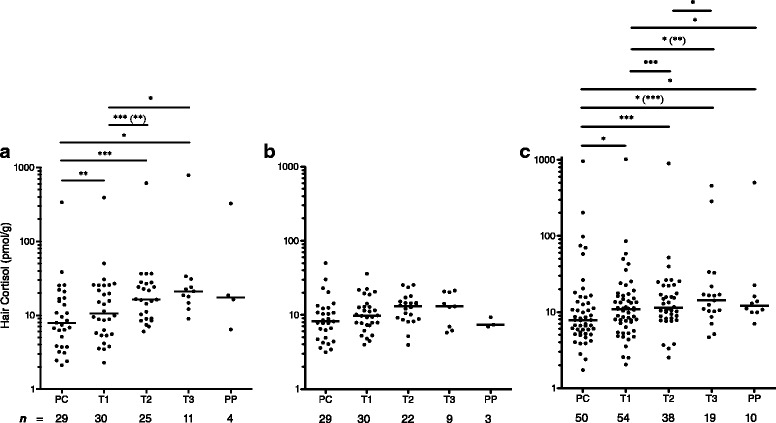
Fig. 1.

Scatter plots of median hair cortisol concentrations. Median hair cortisol concentrations (horizontal bar) in pmol/g of hair are shown for each group of pregnant women (a - Controls, b – No ICS, c – ICS Treated) by pregnancy time point consisting of preconception (PC), first trimester (T1), second trimester (T2), third trimester (T3), and postpartum (PP). Hair cortisol is plotted on a log10 y-axis. Sample sizes for each time point are shown below the x-axis. The change in cortisol over the five time points was significant for the Controls and ICS Treated. Post hoc analysis showed significant differences between time points as indicated in the figure. When analyses were repeated with all hair cortisol concentrations ≥ 276 pmol/g removed, the results were not greatly changed. The alternate p-values are shown in parentheses, ( ). Holm-Bonferroni correction for multiple comparisons was applied to all p-values. *P ≤ 0.05, **P ≤ 0.01, ***P ≤ 0.001
