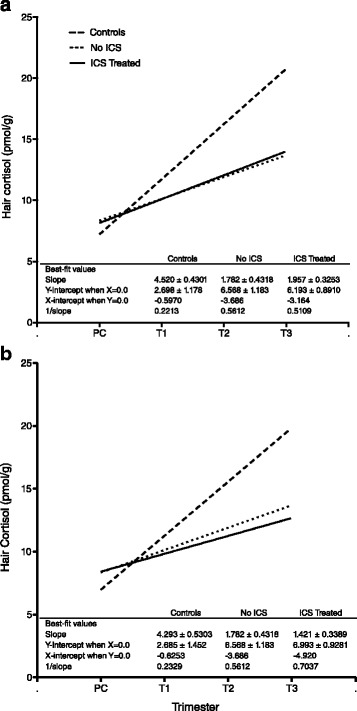
Fig. 2.

Comparison of the change in hair cortisol concentrations during pregnancy. The linear regressions for median hair cortisol concentrations for each group of pregnant women from PC to T3 are shown. The similarity of the slopes for the No ICS and ICS Treated groups can be seen. The difference of those slopes from the slope for the Controls is significant if the samples with concentrations ≥ 276 pmol/g are included (a), but when they are excluded (b), the comparison between the Controls and No ICS is no longer significant. PC = preconception, T1 = first trimester, T2 = second trimester, T3 = third trimester
