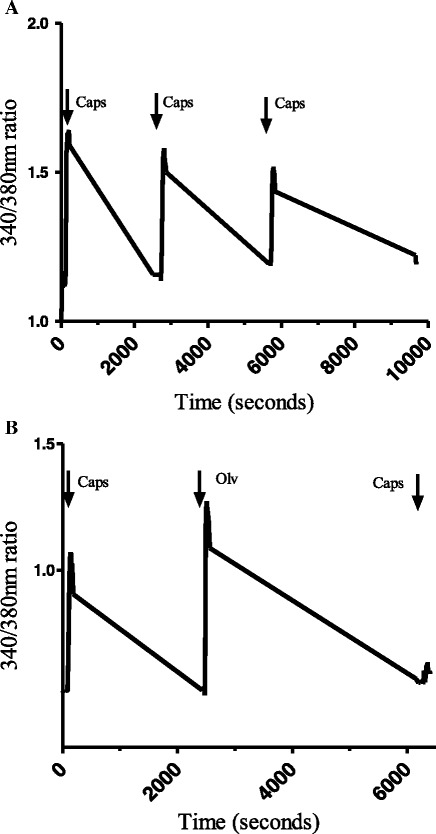
Fig. 6.

Representative traces illustrating changes in 340/380 nm ratios in DRG cells responding to capsaicin and olvanil. a The cell was suprafused with capsaicin (100 nM for 1 min) three times separated by 45 min of wash-out with calcium buffer. b The cell was exposed to capsaicin (100 nM) for 1 min, 45 min later, olvanil (100 nM) was applied for 1 min followed by another 45 min of wash-out. Finally, the cell was exposed again to capsaicin (100 nM for 1 min) followed by 45 min of wash-out
