
Fig. 2.
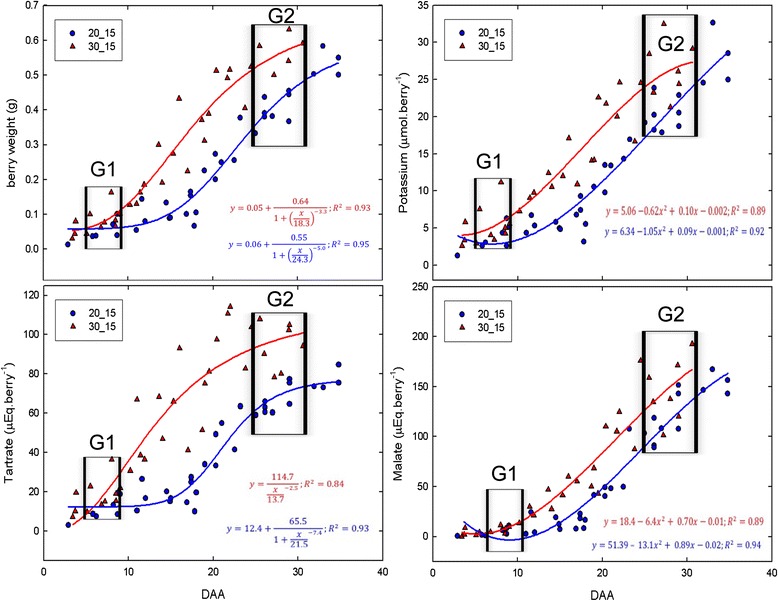
Kinetics of main berry solutes in green berries exposed to different temperature treatments. DAA : Re-calculated Days After Anthesis. Red: high day temperatures; Blue: low day temperature. Lines represent logistic regression fittings
Official websites use .gov
A
.gov website belongs to an official
government organization in the United States.
Secure .gov websites use HTTPS
A lock (
) or https:// means you've safely
connected to the .gov website. Share sensitive
information only on official, secure websites.
Kinetics of main berry solutes in green berries exposed to different temperature treatments. DAA : Re-calculated Days After Anthesis. Red: high day temperatures; Blue: low day temperature. Lines represent logistic regression fittings