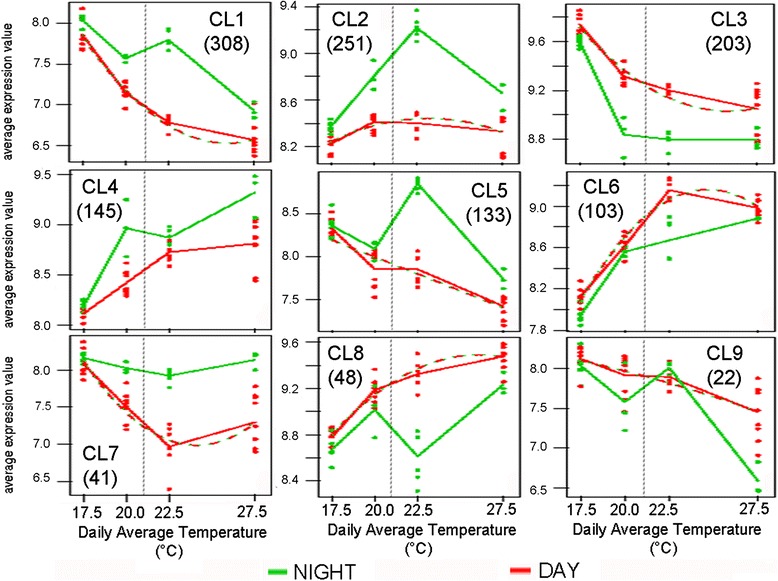
Fig. 6.

Clusters of genes differentially modulated by temperature at day or nighttime, identified by time-series analysis. Name of cluster with the corresponding number of allocated genes is depicted within each graph. Abscissa corresponds to the calculated daily mean temperature of each treatment. Dotted vertical line separates pre-véraison (Green) from post-véraison (Ripening) stages
