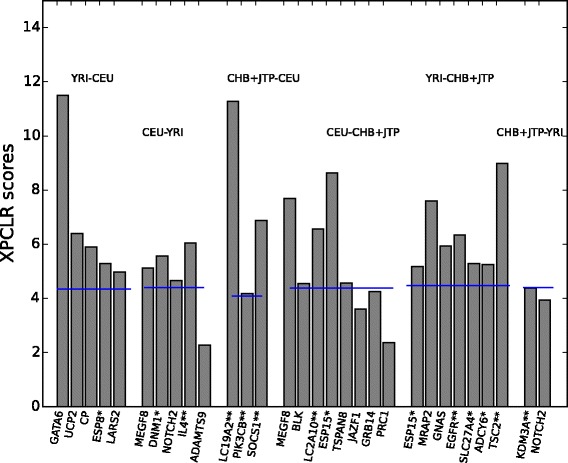
Fig. 2.

Strength of positive selection (XPCLR scores in the y-axis) on genes that are associated with metabolic syndrome. The blue line illustrates the 1 % cut off for each pair. The population pairs where these genes were detected are shown on the top. The first population is always the objective and the second one is the reference. Genes with no star symbol were suggested to be susceptible to metabolic syndrome, with one star, they need further investigation for their association with metabolic syndrome and with two stars, they might offer protection against metabolic syndrome
