
Figure 6.
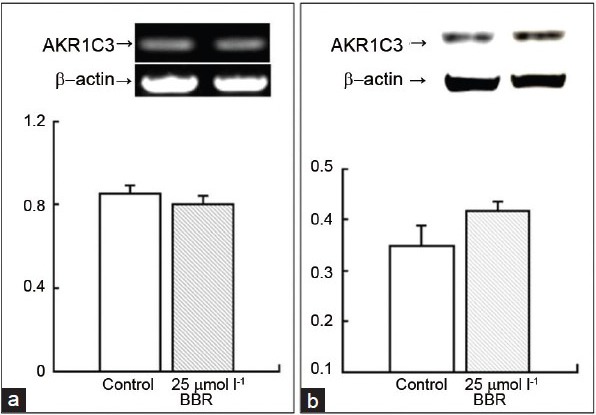
The influence of BBR on AKR1C3 in the level of mRNA and protein. (a) RT-PCR for AKR1C3 gene, the upper panel shows the mRNA bands for the control group and the BBR group, and the lower panel shows the bars for their quantification. (b) Western blot for AKR1C3 gene, the upper panel shows the protein bands for the control group and the BBR group, and the lower panel shows bars for their quantification.