
Fig. 6.
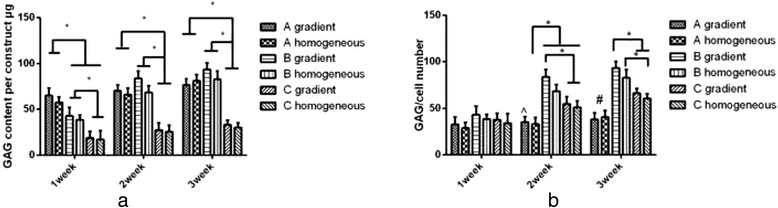
GAG content of the constructs and GAG content normalized to the cell number. a GAG content of the constructs in Groups A, B, and C after 3 weeks of in vitro culture. b GAG content normalized to the cell number. The * indicates significance (p < 0.05). The ^ indicates a significant difference between the gradient construct in Group A and the gradient construct in Group B, the homogeneous construct in Group B, and the gradient construct in Group C (p < 0.05). The # indicates a significant difference between Group A and Groups B and C (p < 0.05). The error bars show the SD (n = 3)