
Fig. 7.
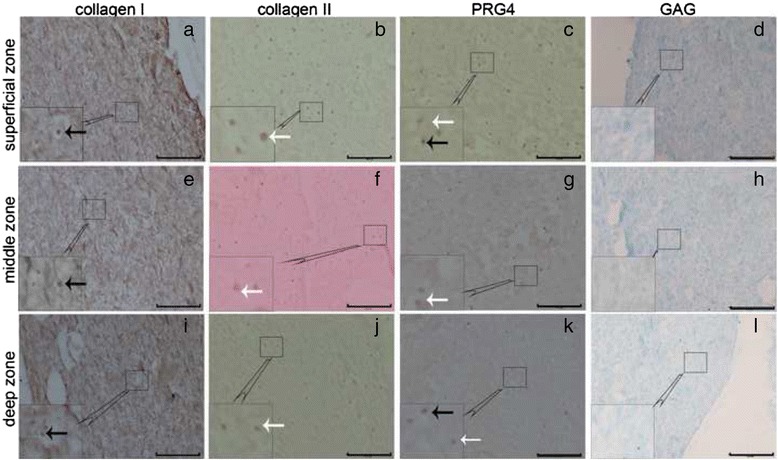
Zonal distribution of ECM in the constructs with the cell density gradient in Group A after 2 weeks of in vitro culture. The images in a, b, c, and d represent the superficial zone; the images in e, f, g, and h represent the middle zone; and the images in i, j, k, and l represent the deep zone. Images of collagen type I immunohistochemical (IHC) staining (a, e, and i); collagen type II IHC staining (b, f, and j); PRG4 IHC staining (c, g, and k) (scale bars: 100 μm). Images of Alcian blue staining (d, h, and l). The white arrows indicate positively stained cells, and the black arrows indicate negatively stained cells (scale bars: 200 μm)