Figure 2.

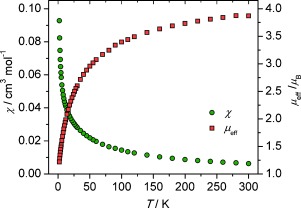
Temperature‐dependent SQUID magnetization data for 3 plotted as μ eff versus temperature (K) (□) and χ vs temperature (K) (○) over the range 1.8–298 K.

Temperature‐dependent SQUID magnetization data for 3 plotted as μ eff versus temperature (K) (□) and χ vs temperature (K) (○) over the range 1.8–298 K.