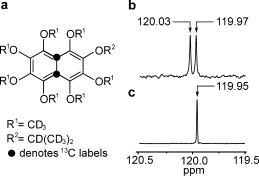
Figure 1.

a) Molecular structure of the naphthalene derivative 13C2‐I. Black filled circles indicate the 13C2 labeling sites. b) 13C spectrum of I in [D6]acetone solution, acquired at 9.4 T with 512 transients. The two peaks separated by 0.06 ppm indicate the resonances of the inequivalent 13C nuclei. c) The 13C spectrum of 13C2‐I acquired at 9.4 T with a single transient shows a single peak with a full‐width‐at‐half‐height of 1.5 Hz.
