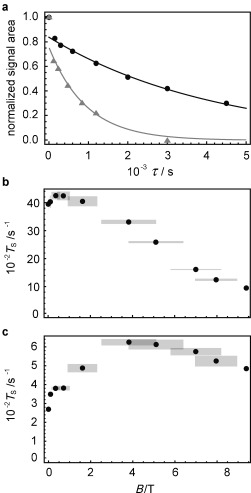
Figure 2.

a) Experimental decay curves for 0.1 m 13C2‐I dissolved in degassed [D6]acetone obtained using the pulse sequence in the Supporting Information for magnetic fields B=9.39 T (gray triangles) and 0.4 T (black circles). Experimental points have been normalized to the value of the first point. Solid lines are fits to exponential decays, ignoring the first point at τ=1 s. Experimental field dependence of T S for 13C2‐I in [D6]acetone for b) a degassed sample, and c) a non‐degassed sample with [O2]≈2 mm. Gray rectangles represent the confidence intervals.
