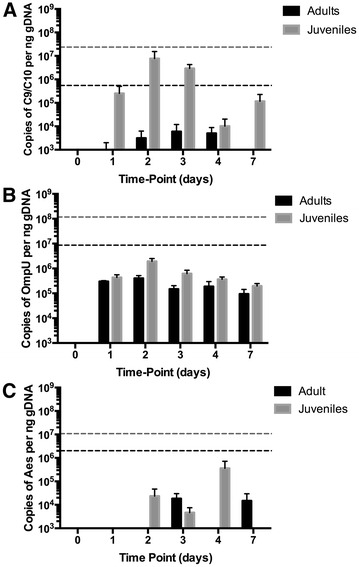
Figure 2.

Pathogen load in juvenile and adult oysters. The concentration of OsHV-1 (Graph A), Vibrio LGP32 (Graph B) and Vibrio aestuarianus (Graph C) DNA is shown in the tissues of adult (black bars) and juvenile (grey bars) Crassostrea gigas (mean ± SD). The concentration of pathogen DNA was below detectable limits at 0 h post injection. Horizontal lines represent the average concentration of pathogen DNA in the tissues of moribund adult (dash black line) and juvenile (dash grey line) C. gigas.
