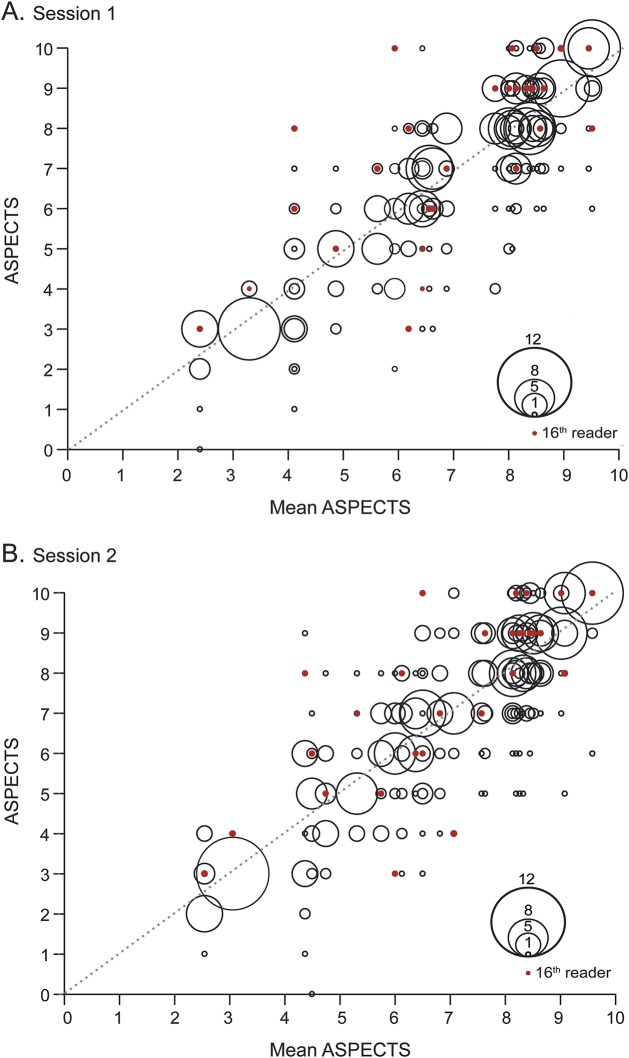
Figure 3. Graphic representation of the distribution of the Alberta Stroke Program Early CT Score (ASPECTS).
For each patient, represented on the x axis by the mean value of the ASPECTS given by all raters, the distribution of ASPECTS values given by raters is represented on the y-axis by bubbles. The bubble area is proportional to the number of raters who gave the same score (see the bubble scale). Red dots represent the ASPECTS given to each patient by the radiologist on-call. Perfect agreement would have been represented by large bubbles aligned along the diagonal formed by red dots.

