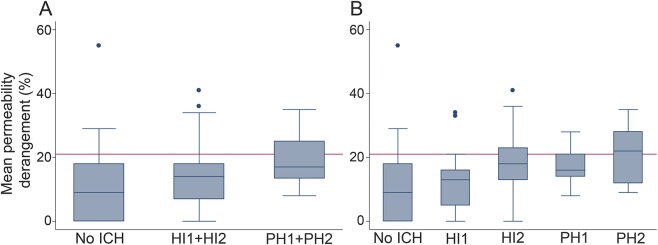
Figure 1. A comparison of the pretreatment blood–brain barrier disruption with the posttreatment hemorrhage grade.
(A) Boxplots for the mean permeability grouped by no-ICH, HI1 + HI2, and PH1 + PH2. (B) Boxplots for each group individually. The red line on both graphs is the 21% threshold identified in the prior study as potentially being predictive of PH. HI = hemorrhagic Infarction; ICH = intracranial hemorrhage; PH = parenchymal hematoma.

