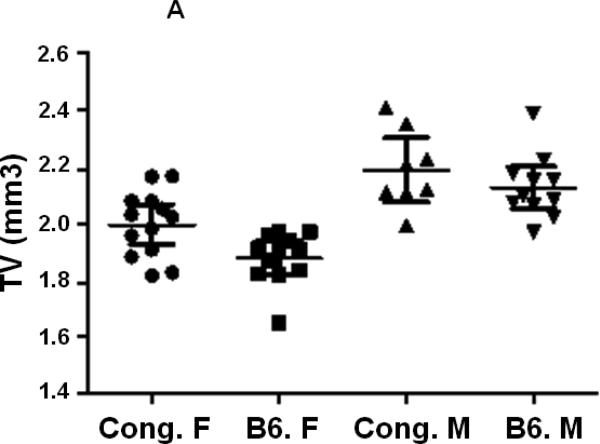
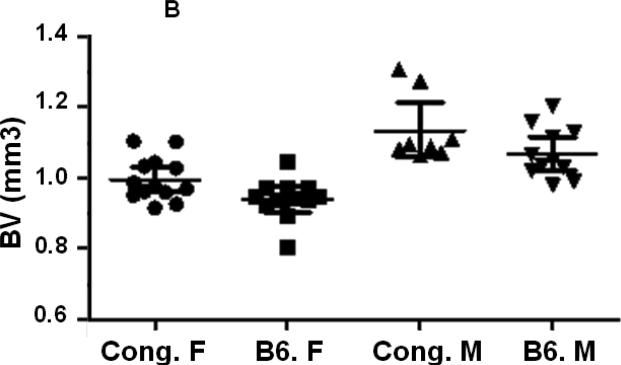
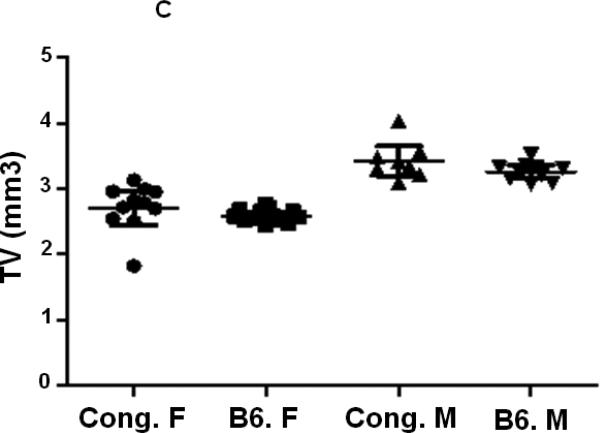
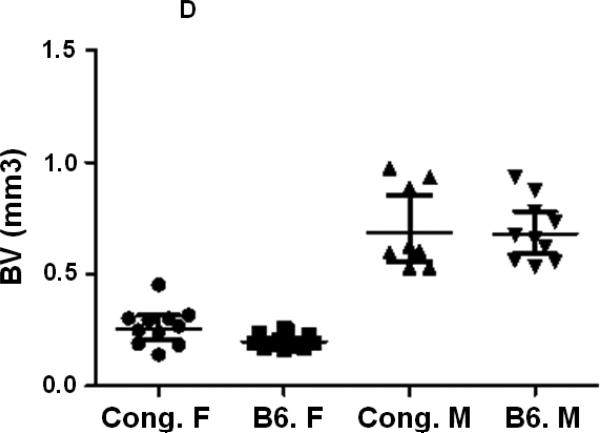
Figure 2.
Cortical and trabecular bone volume and tissue volume from both male and female congenic and B6 control mice. A. Tissue volume at the femur mid-diaphysis and B. Cortical bone volume for individual Congenic and B6 control mice. C. Tissue volume at the femur metaphysis region and D. Trabecular bone volume for individual congenic and B6 control mice. Data are presented as the values of individual animals ± 95% Confidence interval. n = 8-13.


