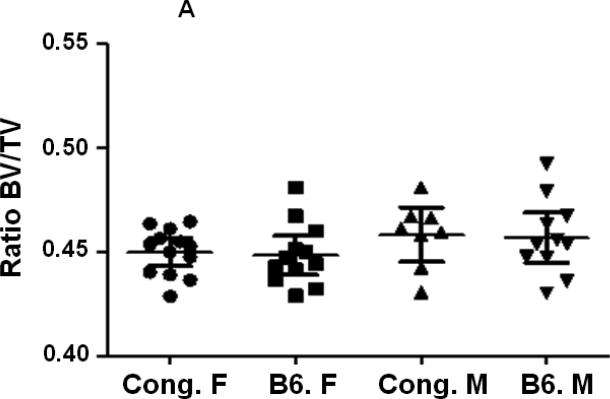
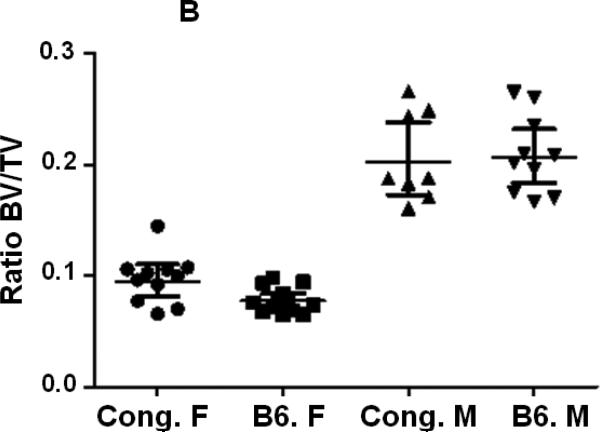
Figure 3.
Cortical and trabecular bone volume on tissue volume of congenic and B6 control mice from both genders. A. Cortical BV/TV of congenic and B6 control mice. B. Trabecular BV/TV of congenic and B6 control mice. Data are presented as the values of individual animals ± 95% Confidence interval. n = 8-13.


