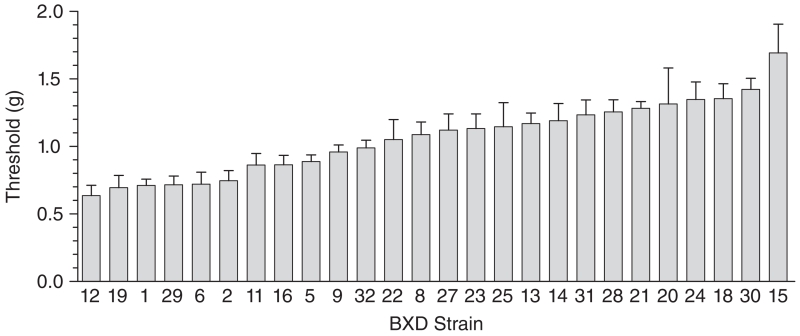
Figure 1. Overall von Frey threshold means for the 26 BXD RI strains surveyed show a significant effect of strain (P < 0.001) and a wide range of sensitivity among the strains (N = 204; n = 6–9/strain).
The calculated heritability estimate (h2 = 0.44) indicates that 44% of the overall trait variability is because of additive allelic variance (polymorphisms) among the inbred strains. Error bars represent standard error of the mean (SEM).

