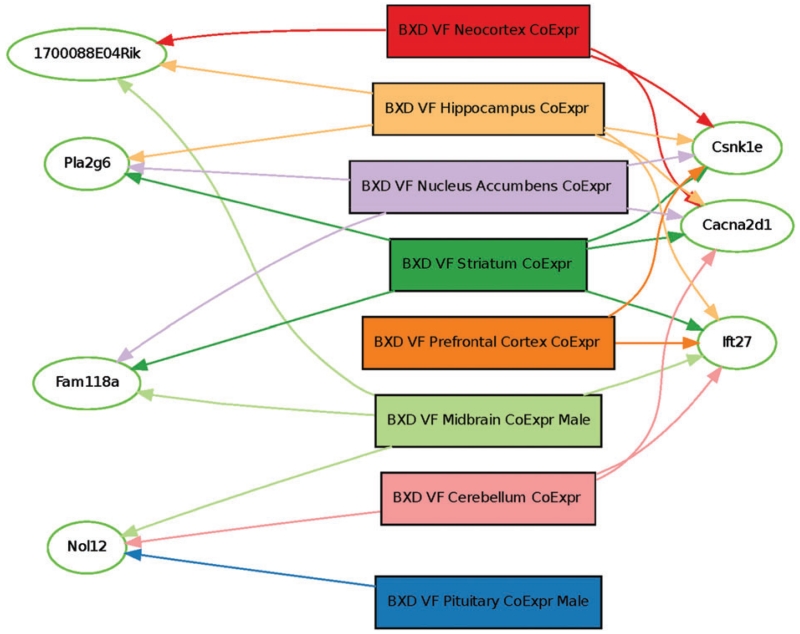
Figure 3. Transcript-trait covariance across brain regions.
Genes with transcription covariance to von Frey sensitivity are depicted by oval shaped nodes. Brain regions are represented by rectangular nodes. The most highly connected genes based on correlation P < 0.001 are represented on the right side of the graph. One-thousand four-hundred and seventy genes are significantly correlated to von Frey responding in any tissue, with only 44 genes correlated in two or more tissues. Only those genes represented here are correlated in three or more tissues.

