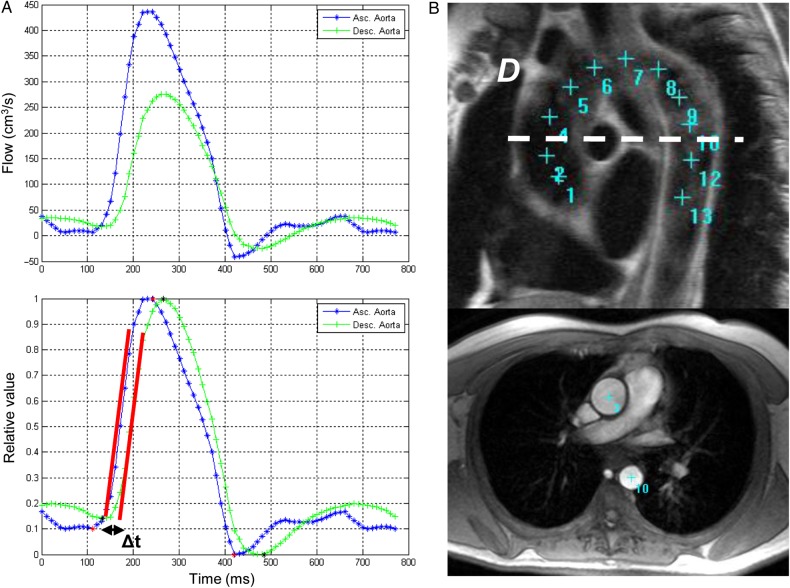
Figure 2.
Aortic arch PWV method. (A) Transit time (Δt) method of peak flow between ascending and descending aortic location. Before peak flow normalization (upper) and after peak flow normalization (lower). Δt was estimated as the time shift providing the highest correlation between ascending and descending aortic velocity. (B) Measurement of the transit distance (D) in the aortic arch. Aortic arch view (upper) and PC cine transverse view (lower) on MRI.

