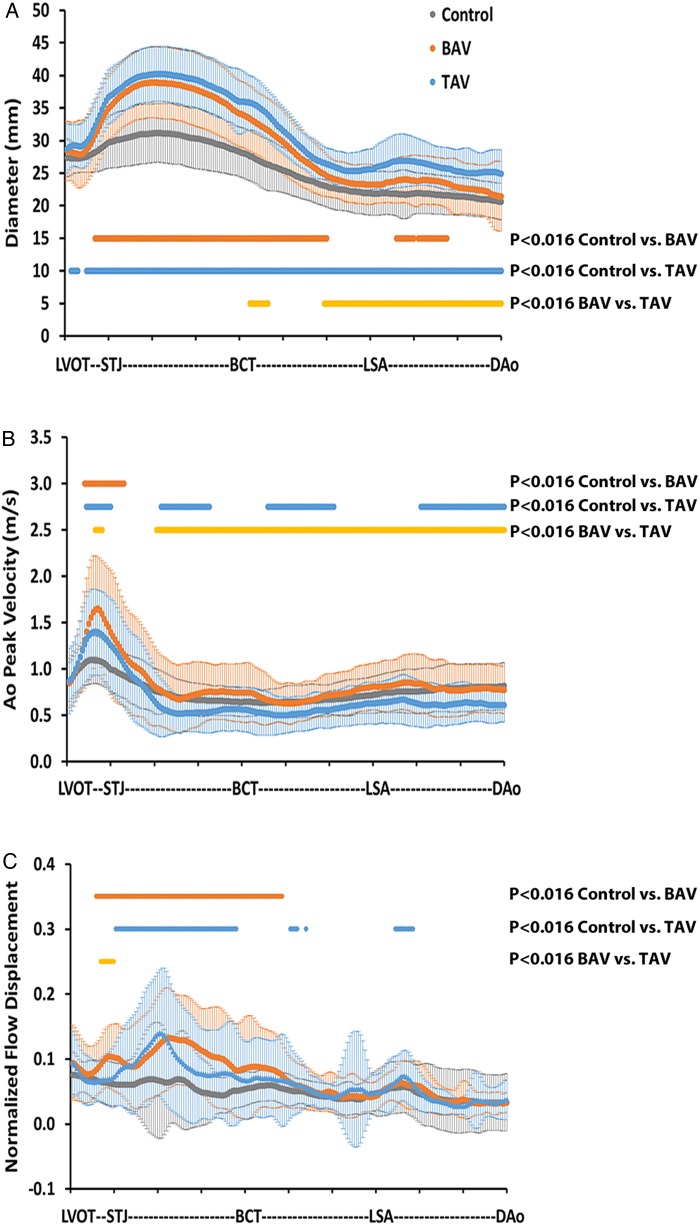
Figure 4.
Morphometric and haemodynamic measurements in the entire aorta. (A) Aorta diameter for healthy controls (grey dots and bars for mean and standard deviation), patients with BAV (orange dots and bars for mean and standard deviation) and TAV patients (blue dots and bars for mean and standard deviation). (B) PV for controls, patients with BAV and TAV. (C) Normalized flow displacement for controls, patients with BAV and TAV. Orange dots indicate significant differences between controls and BAV patients. Blue dots indicate significant differences between controls and TAV patients. Yellow dots indicate significant differences between BAV and TAV patients. P < 0.016, after Bonferroni correction.

