Figure 1.
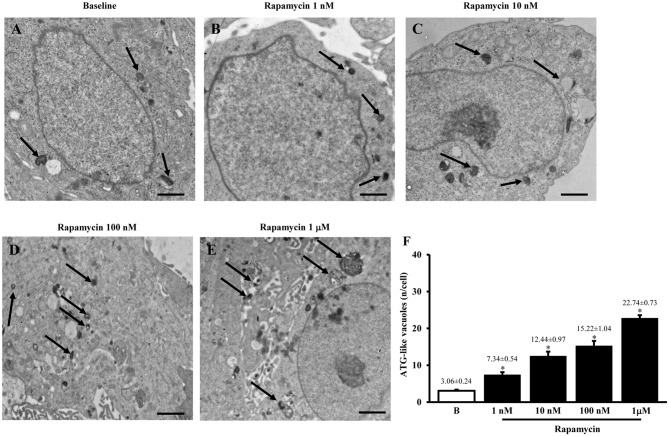
Plain electron microscopy of U87MG cells. Representative pictures of ATG-like vacuoles in the cytoplasm in baseline conditions (arrows) (A) and after increasing doses of rapamycin (B–E) as visualized in representative micrographs. The mean number of ATG-like vacuoles per cell was counted and values were reported in graph (F). This graph shows that rapamycin induces dose-dependently (1 nM; 10 nM; 100 nM and 1 μM) an increase in the number of ATG-like vacuoles compared with baseline conditions (B). Values are given as the mean ± S.E.M. Comparisons between groups were made by using one-way ANOVA. *P ≤ 0.05 compared with baseline conditions. Scale bars (A–E) = 1μm.

