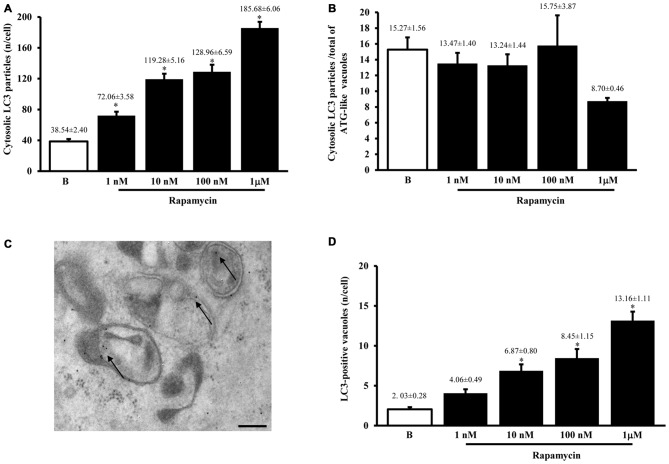
Figure 2.
LC3 immunocytochemistry. The number of cytosolic LC3 immunogold particles significantly increases dose-dependently after rapamycin (1; 10; 100; nM and 1 μM) compared with baseline conditions (B) as reported in graph (A). When rapamycin-dependent increase in immunogold particles was plotted vs. rapamycin-dependent increase in ATG-like vacuoles reported in Figure 1F, we measured a similar trend as witnessed by the steady values reported in graph (B) for baseline conditions (B) and different doses of rapamycin (1 nM; 10 nM; 100 nM and 1 μM). This suggests that LC3 particles and ATG-like vacuoles express the same phenomenon (ATG status). To confirm this analogy we carried out LC3 immunocytochemistry for ATG vacuoles as shown in representative picture (C) where authentic ATG vacuoles possessing different shapes and a double membrane were stained with LC3 immunogold particles (shown by arrows; gold standard procedure according to Klionsky et al., 2016). This procedure allowed to count authentic ATG LC3-positive vacuoles, which were reported in graph (D). This graph shows that rapamycin induces dose-dependently (1 nM; 10 nM; 100 nM and 1 μM) an increase in the number of ATG LC3-positive vacuoles compared with baseline conditions (B). The increase in ATG-like vacuoles observed in Figure 1F was matched by such an increase in ATG LC3-positive vacuoles reported in panel D. In (C) vacuoles stained with LC3 immunogold particles (arrows) show different shape. The absolute number of LC3-positive vacuoles increases dose dependently (D). Values are given as the mean ± S.E.M. Comparisons between groups were made by using one-way ANOVA. *P ≤ 0.05 compared with baseline conditions. Scale bar (C) = 250 nm.

