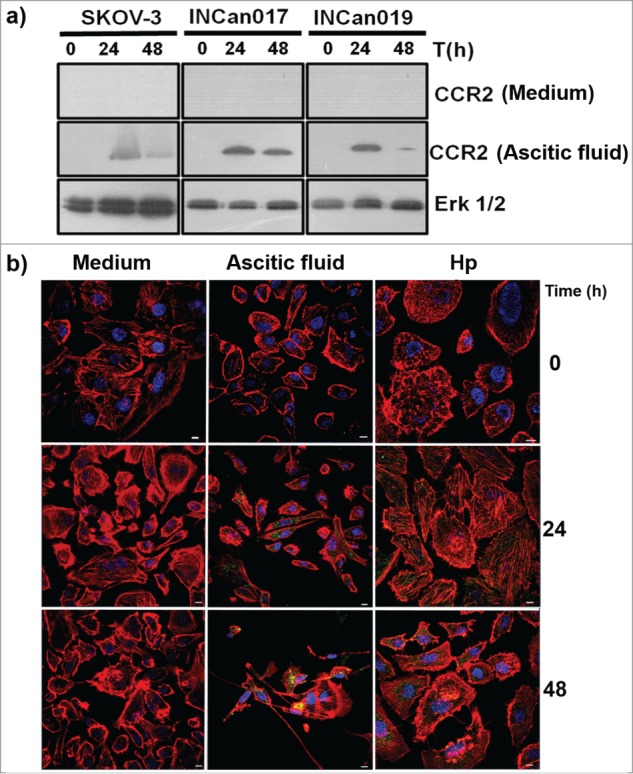
Figure 4.

Time-dependent expression of CCR2 in the cells that were exposed to medium, ascitic fluid, and haptoglobin induces changes in actin cytoskeleton. (A) Total extracts of the 3 cell types were processed for protein gel blot assays to analyze the expression level of the CCR2 receptor for 0, 24 and 48 h of exposure in the medium and ascitic fluid. (B) The same kinetics were analyzed by confocal microscopy with a 40 × objective using an LMS 700 confocal microscope; nuclei were stained with DAPI (blue, 1:50), actin structures with rhodamine-phalloidin (red, 1:25), and CCR2 with a primary anti-CCR2 antibody (1:1000 for western blot and 1:100 for confocal microscopy) and a secondary-FITC conjugated antibody (green). The merged zones are shown in yellow. The cells were stimulated with Hp (purified human cancer-free serum). Bar scale = 100 μm. (C) From the cells that were exposed to medium, ascitic fluid or Hp, randomly selected fields to which an optical zoom (crop) was performed were subjected to an ortho analysis to obtain the zx, zy and zz axes from each image. Bar scale = 100 μm. (D-G) A quantitative analysis was performed using the software Zen 2011 (Blue edition, Carl Zeiss). A Shapiro-Wilk analysis was performed to evaluate the data distribution. To determine the differences among the conditions (culture medium, ascitic fluid, and Hp), a Mann-Whitney analysis for non-parametric data was applied. The analyses were performed for at least 30 cells under each condition (P < 0.001).
