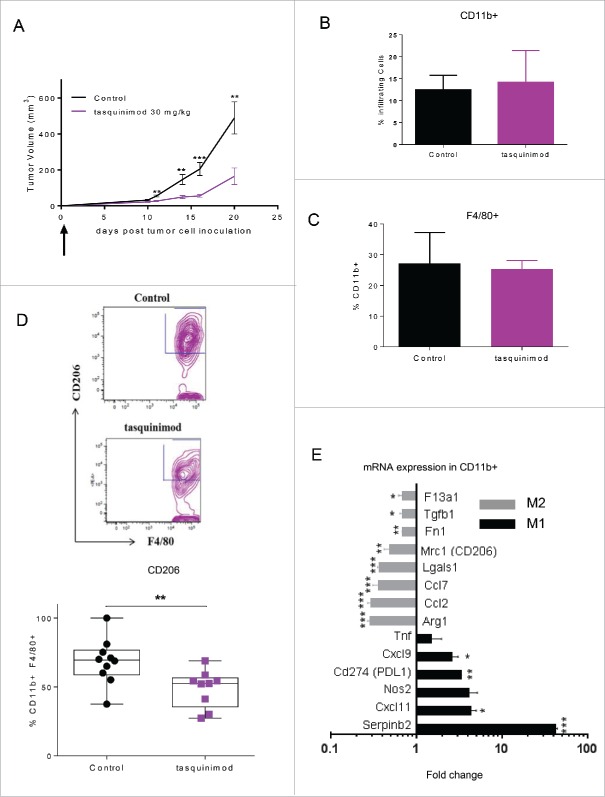
Figure 3.
Tasquinimod treatment modulates the immunosuppressive activity of tumor-infiltrating myeloid cells (A) MBT-2 tumor growth treated with the most effective dose of tasquinimod in this model: 30 mg/kg (oral gavage, twice daily) using 10 mice per group. Treatment was initiated at day 1 post-tumor cell inoculation (Student test; **p < 0.005; ***p < 0.001). (B) Quantitative data of the percentage of (B) tumor infiltrating myeloid cells (CD11b+), (C) macrophages (CD11b+ F4/80+) and (D) M2 macrophages (CD11b+ F4/80+ CD206+) at day 20. Representative gating strategy is shown in the upper figure. Quantitative data were pooled from two independent experiments in the lowest figure. Each experiment was conducted with five mice per group using cytometric analysis (Student test; *p < 0.05). (E) CD11b+ cells were sorted from MBT-2 tumors treated or non-treated with tasquinimod at 30 mg/kg for 20 d using BD FACSAria II. mRNA levels are normalized by cyclophilin-A mRNA level (delta CT method). Data are expressed relative to their respective control set to 1. Fold change of gene expression profiling for M2 (gray bars) or M1 markers (black bars) of TAMs is indicated. Data are mean ± SEM. Asterisks denote statistical significance using student test (*p < 0.05; **p < 0.005; ***p < 0.001).

