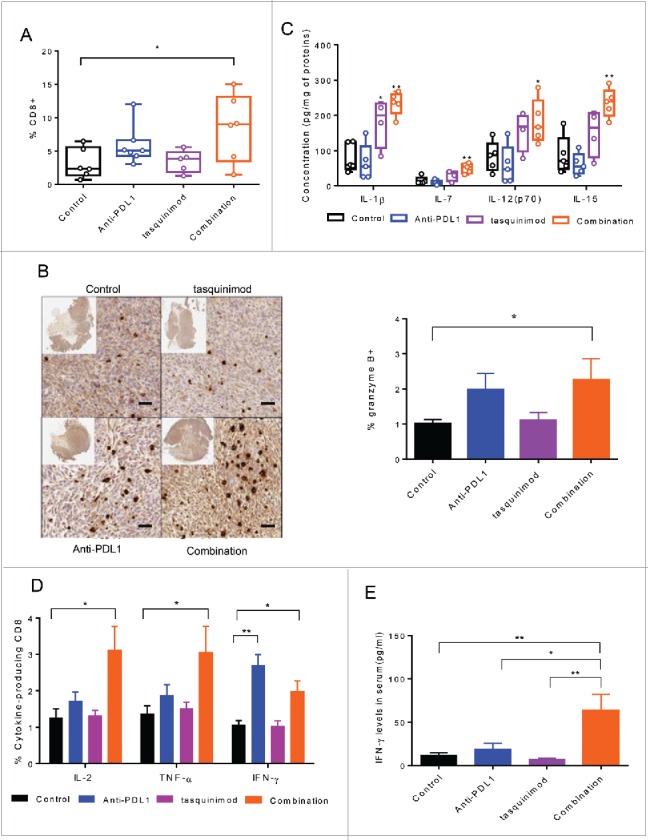
Figure 6.

Combination of tasquinimod with Anti-PD-L1 increases cytotoxic T cell activity. (A) Quantitative data of the percentage of tumor-infiltrating CD8+ cells on day 15 after treatment (n = 6). (B) Left panel: Representative images showing immunostaining for granzyme B (brown staining) in tumors from control or treated groups. Original magnification: X200, inset: tumor overview. Scale bar: 50 µm. Right panel: Quantification of granzyme B positive cells on tumor sections expressed as a percentage of total cells using an antibody against granzyme B (Kruskal–Wallis test; *p = 0.0326). (C) The concentration levels (pg/mL) of the following cytokines: IL-1β, IL-7, IL-12(p70) and IL-15 in tumor lysate from each group were quantified using Luminex Technology (n = 5). (D) Splenocytes (n = 5) from each group were stimulated with PMA/ionomycin in the presence of Brefeldin A. IL-2, TNF-α and IFNγ production was examined by intracellular staining. Representative data (means ± SEM) showed the percentage of the different cytokines gated on CD8+ analyzed by flow cytometry. Asterisks denote statistical significance using one-way ANOVA (*p < 0.05; **p < 0.005). (E) Bars represented IFNγ concentrations in the serum of 10 mice from each group of treatment. p values were calculated based on Kruskal–Wallis test between the different groups (*p < 0.05; **p < 0.005).
