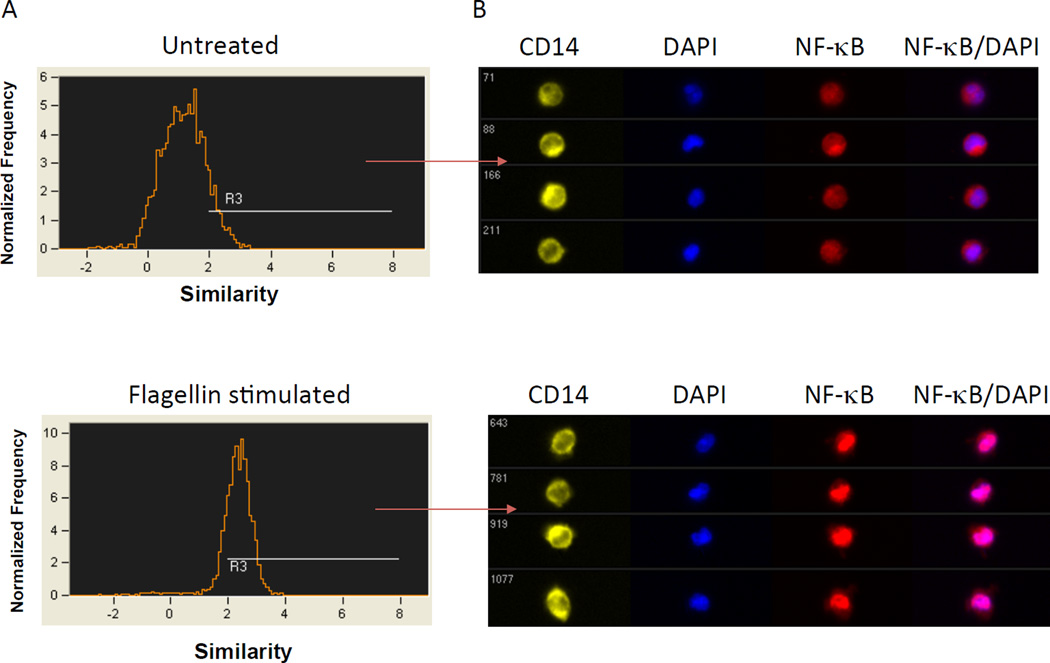
Figure 2. Translocation of NF-κB in human monocytes after stimulation.
The translocation of NF-κB (p65) into the nucleus after stimulation (R3) is depicted in populations of untreated and stimulated cells. The median value of similarity scores is 1.16 in untreated sample and 2.34 in stimulated sample (A). Digital images collected simultaneously of the untreated or flagellin - stimulated cell populations show representative cells and the intensity of NF-κB translocated into the cell nucleus (B).

