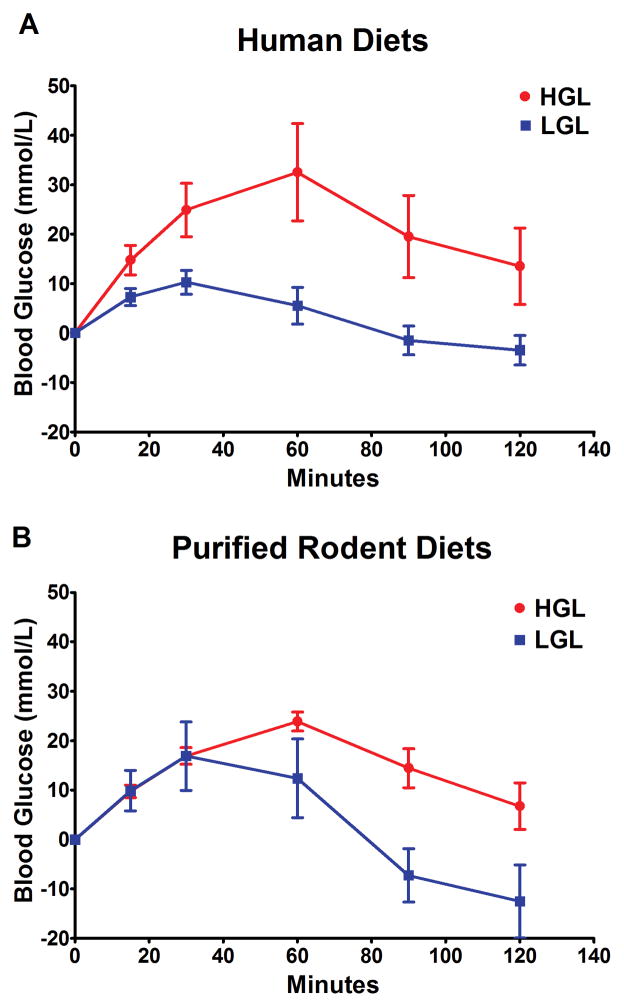
Fig. 3.
Effect of diets varying in available carbohydrate content on glycemic response in the rat. The glycemic response to diets prepared for human consumption whose calculated glycemic load was 244 (HGL) and 117 (LGL). (A) when fasted rats were gavaged (1 g carbohydrate/kg body weight) with the composite human diets, prepared as described in the methods section, the mean area under the curve, using the analysis of incremental area, was 105 (95% CI = 26.6 to 183.6) and 18 (95% CI = 42.0 to 28.7) for HGL and LGL, respectively. The glycemic response for purified rodent diets (Supplementary Table S2). (B) the mean area under the curve, using the incremental area method of analysis, was 72 (95% CI = 47.2 to 96.3) and 19 (95% CI = −37.4 to 76.2) for HGL and LGL, respectively. Factorial analysis of variance of the area under the curve values for each diet (n = 8 per diet group) indicated that the low versus high glycemic load diets differed (P = 0.009), but the differences between the human and purified rodent diets were not statistically significant (P = 0.705). HGL = High glycemic load diet; LGL = low glycemic load diet.

